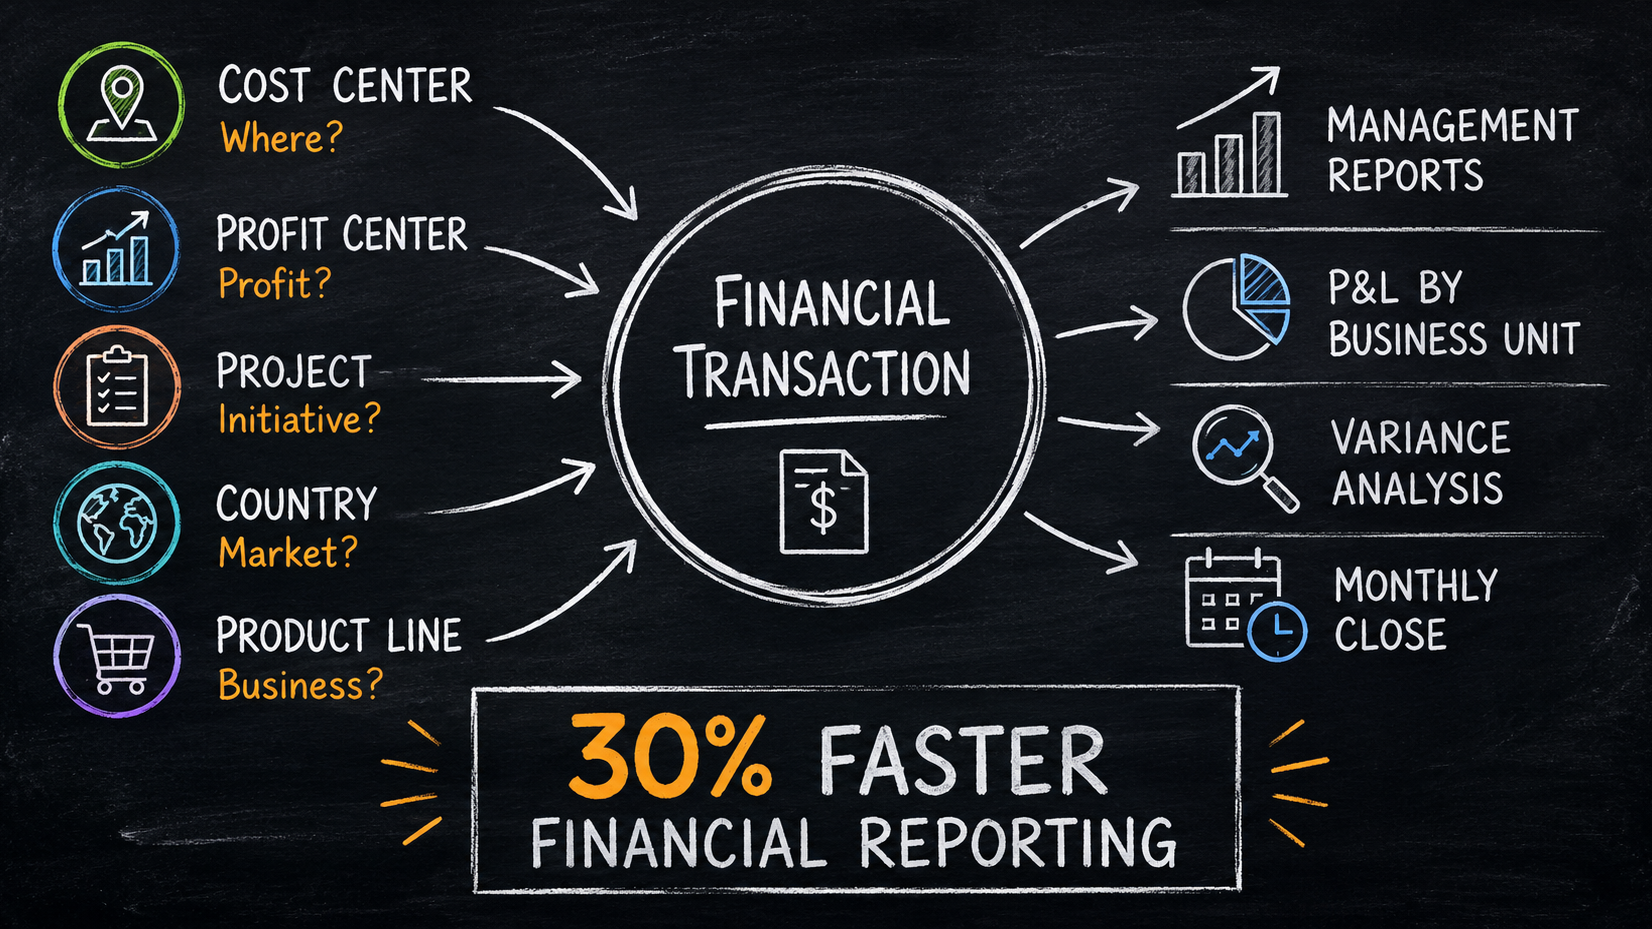
Poorly designed analytical dimensions are one of the most underestimated causes of slow financial closes. According to Gartner, standardizing chart-of-accounts and reporting structures can cut period-end close time by 20-30%. Selecting a minimum viable set of dimensions and designing them consistently from day one is the highest-leverage action a CFO can take before or during an ERP implementation.
Introduction
Most finance teams that struggle with slow closes and messy variance analysis are not suffering from a data problem. They are suffering from a structure problem. They built their analytical dimensions reactively, adding layers over time, accommodating local requests, never stepping back to ask whether the architecture still made sense. The result: a chart of accounts that has grown into a maze, reporting that requires manual reconciliation, and a finance team spending the last week of every month firefighting instead of analyzing.
1. What analytical dimensions are
Analytical dimensions are the objects you attach to every financial transaction to add management context beyond the account code. Each serves a distinct purpose, and confusing them is one of the most expensive mistakes we see in ERP implementations.
-
A cost center answers “where did this cost occur?” a department, a production line, a support function. It collects costs but does not produce a P&L.
-
A profit center answers “is this activity profitable?” it carries both revenue and costs, enabling a full business unit view.
-
Internal orders are temporary collectors for short-term initiatives: a marketing campaign, a store opening, a major repair.
-
Projects are for complex, multi-phase projects with their own budget, and revenue recognition rules.
The most common mistake is treating these objects as interchangeable, or adding new ones without governance. When a new business unit launches, someone adds a dimension. When a project needs tracking, another layer appears. Over three years, a company that started clean ends up with overlapping objects, inconsistent naming across legal entities, and lack of ownership.
According to Deloitte’s 2024 CFO survey, finance teams still spend 60-70% of their time on data gathering and reconciliation (largely because of fragmented analytical structures exactly like this).
2. How do you select the right dimensions for your reporting needs?
Start from reporting outputs, not from the org chart. This is the most important design principle, and it is consistently violated.
The right approach works backwards from three questions:
-
What do you use to run your business?
ex: by country and product line, by customer and service type, by project … -
Who is accountable for what?
The idea here is to provide managers with an accurate picture of what they own, so they can actually do something about it. -
Which report do you actually look at every month?
Not the report that gets produced. The report that gets reviewed. The difference is significant. This question immediately eliminates 40% of the “nice-to-have” dimensions that never make it into management reporting. -
What is your biggest blind spot today?
Where are you spending money without knowing whether it’s profitable?
Gartner research indicates that organizations which standardize and rationalize their chart of accounts and reporting structures can reduce time spent on the period-end close by 20-30% (Gartner, “Improve the Financial Close With a Standardized Chart of Accounts,” 2023).
Start by running a dimension mapping workshop. The output is a simple matrix: each proposed dimension mapped against the reports it enables, the team responsible for maintaining it, and its expected stability over three years. Dimensions that cannot justify their existence are removed.
One practical rule: resist the pressure to accommodate every local reporting need at the dimension level. Local needs can be met through reporting filters or sub-dimensions, without polluting the consolidation layer.
Conclusion
The dimension model is not a configuration detail. It is a strategic decision that shapes decision making for years. If your close is running longer than ten working days, or variance analysis still requires manual assembly in Excel, the structure is almost certainly part of the problem, and it is one of the fastest things to fix when you know where to start.
FAQ
What are analytical dimensions in financial reporting?
Analytical dimensions are objects attached to financial transactions (cost centers, profit centers, internal orders, projects), that add management context beyond the GL account. Organizations with well-structured dimensions report up to 50% less manual data manipulation. Start by mapping dimensions to actual management reports before configuring your ERP.
How many analytical dimensions does a mid-market company actually need?
Most mid-market companies across multiple entities need four to five core objects: legal entity, cost center, profit center, and project tracking. McKinsey (2024) found streamlined analytical structures reduce FP&A data preparation time by 25-30%. Handle local reporting needs at the filter level, not by adding dimensions to the consolidation model.
Why does a poorly designed chart of accounts slow down the monthly close?
When dimensions are inconsistent across entities, every close requires manual reconciliation before consolidation can begin. Gartner research shows that standardizing chart-of-accounts and reporting structures can cut period-end close time by 20-30%. Aligning dimension taxonomies across all legal entities is the most direct way to recover that time.
Your close is taking too long and the fix may be simpler than you think.
Explore how we can help

